 729
729
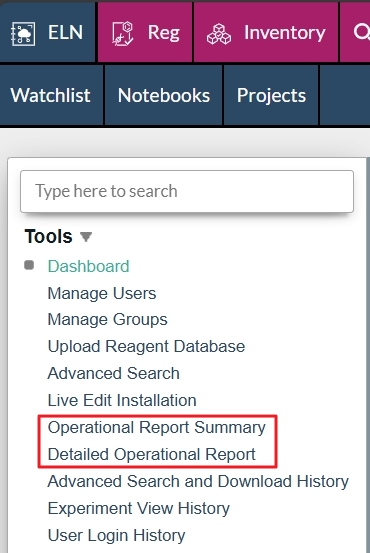
If you are an Arxspan user with access to the Operational Reports, the options will be visible in your left navigation bar. There are two options, Operational Report Summary and Detailed Operational Report. This article contains instructions on running each report type.
Please note as of August 14, 2023, only Arxspan users with an Admin level user role have access to the Operational Report Summary and the Detailed Operational Report. Please contact Arxspan Support with any questions.

OPERATIONAL REPORT SUMMARY
The Operational Report Summary page provides administrators with an at-a-glance summary of users and their most recent activity. This allows an administrator to run and retrieve a report to quantify a user’s number of experiments by experiment status, as well as by providing a time stamp representing some of the user’s most recent activity.
The table displays all users unless filtered; filtering by group and displaying deactivated users is an available option (1). Once run, the Operational Report Summary results can be sorted by selecting the up/down triangle next to the column header of interest (2). Additionally, a more detailed report can be accessed by selecting a user’s name from the table (3). For longer user lists, there is an option to filter the currently displayed list (4). If desired, this report page can be downloaded as a CSV file (5).
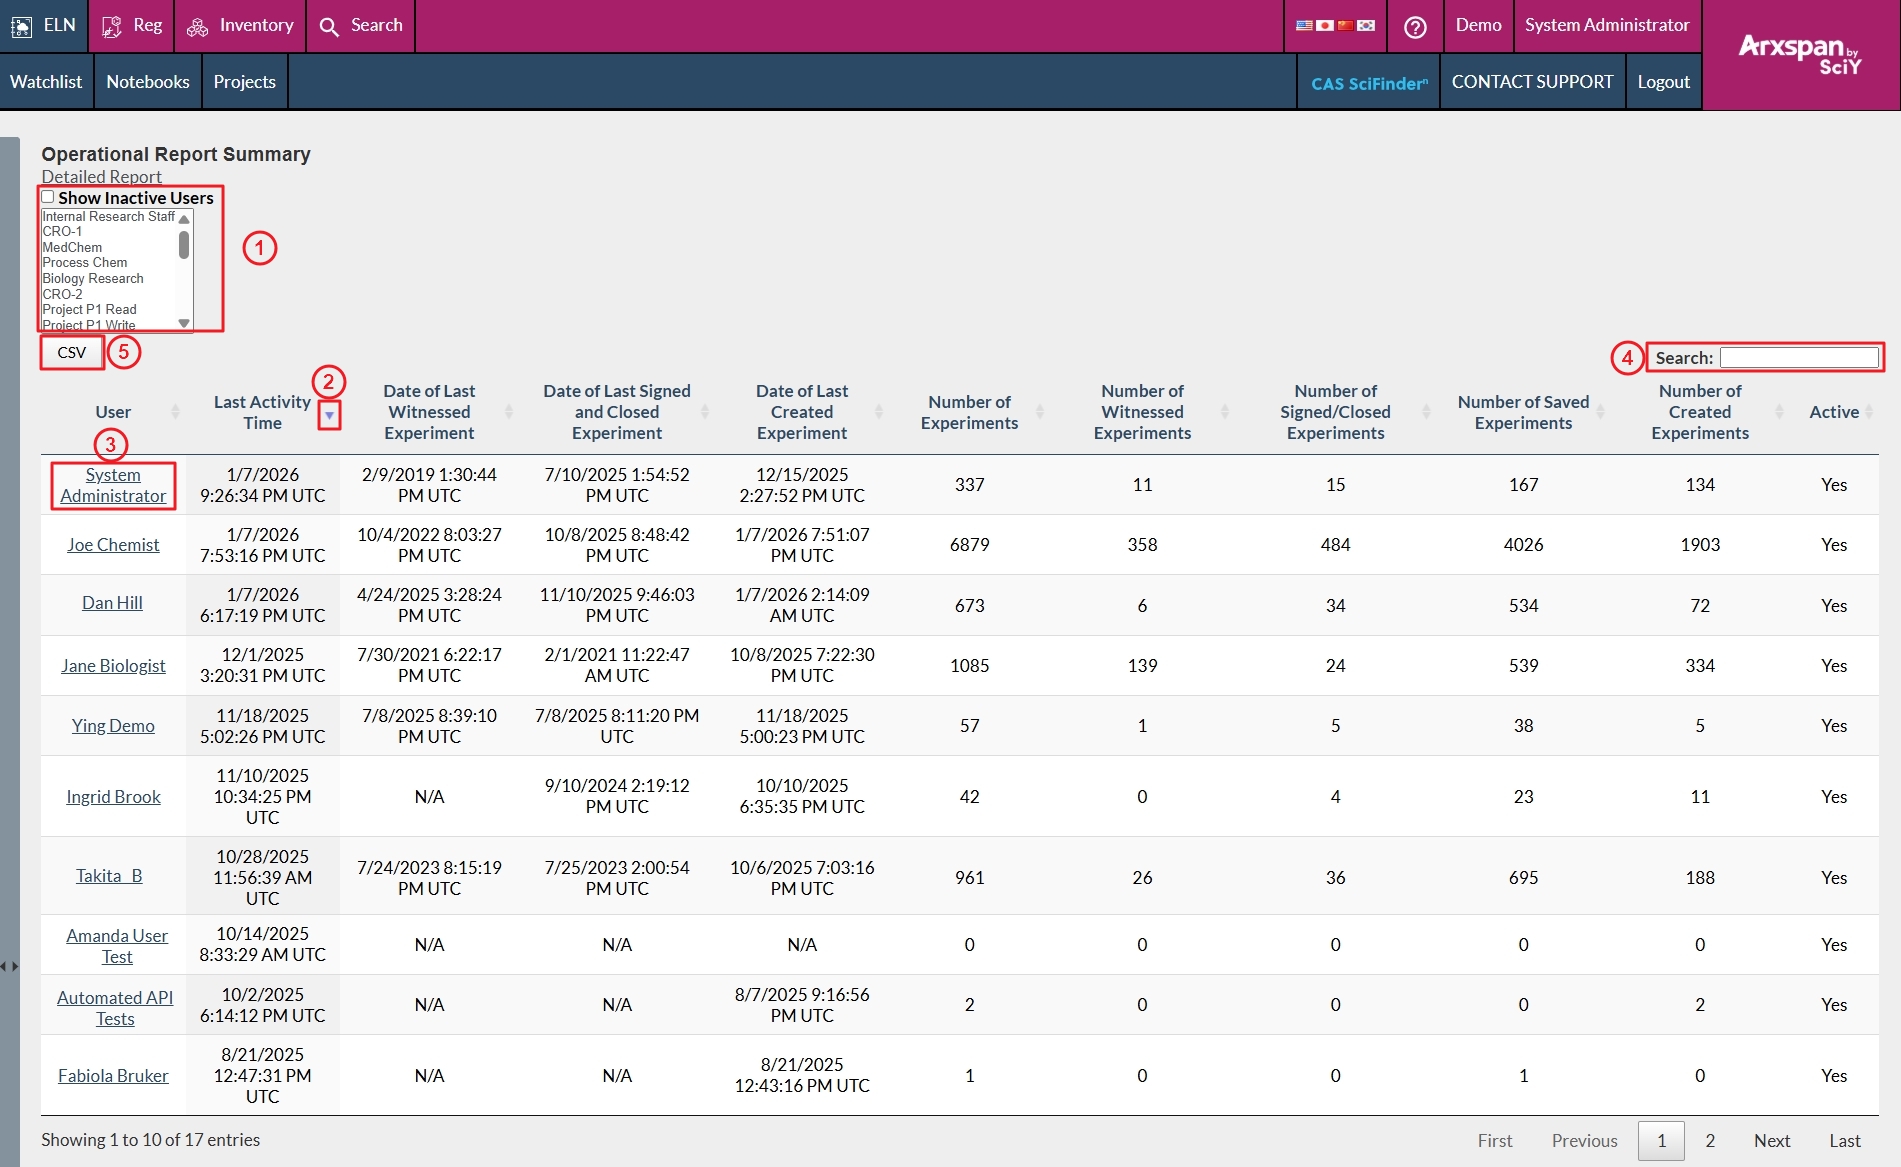
The chart below provides a description of each Operational Report Summary column header value as displayed in the provided screenshots.
| Operational Report Summary Column Header Name | Description of Operational Report Summary Column Header Value |
|---|---|
| User | First and Last name of the Arxspan user, as displayed in the Manage Users page |
| Last Activity Time | Date and time of a user was last logged into Arxspan, just prior to the user logging out |
| Date of Last Witnessed Experiment | Date and time of the most recent witnessed experiment of which the user is the owner of; this date/time reflects the witness‘ activity, not the most recent experiment the user witnessed for someone else |
| Date of Last Signed and Closed Experiment | The most recent date and time and experiment, owned by the user, with a status of Signed/Closed (including collaborative experiments in which a collaborator has signed/closed, without the user signing the experiment themself) |
| Date of Last Experiment Created | Date and time of the most recent experiment created by the user |
| Number of Experiments | Total number of experiments owned by the user (this number will not include experiments in which the user the user is a collaborator on or deleted experiments) |
| Number of Witnessed Experiments | Total number of experiments, owned by the user, with a status of Witnessed |
| Number of Signed/Closed Experiments | Total number of experiments, owned by the user, with a status of Signed/Closed (including collaborative experiments in which a collaborator has signed/closed, without the user signing the experiment themself) |
| Number of Saved Experiments | Total number of open experiments, owned by the user, with a status of Saved or Reopened |
| Number of Created Experiments | Total number of open experiments, owned by the user, with a status of Created |
| Active | If Yes, the user’s Arxspan account is Enabled |
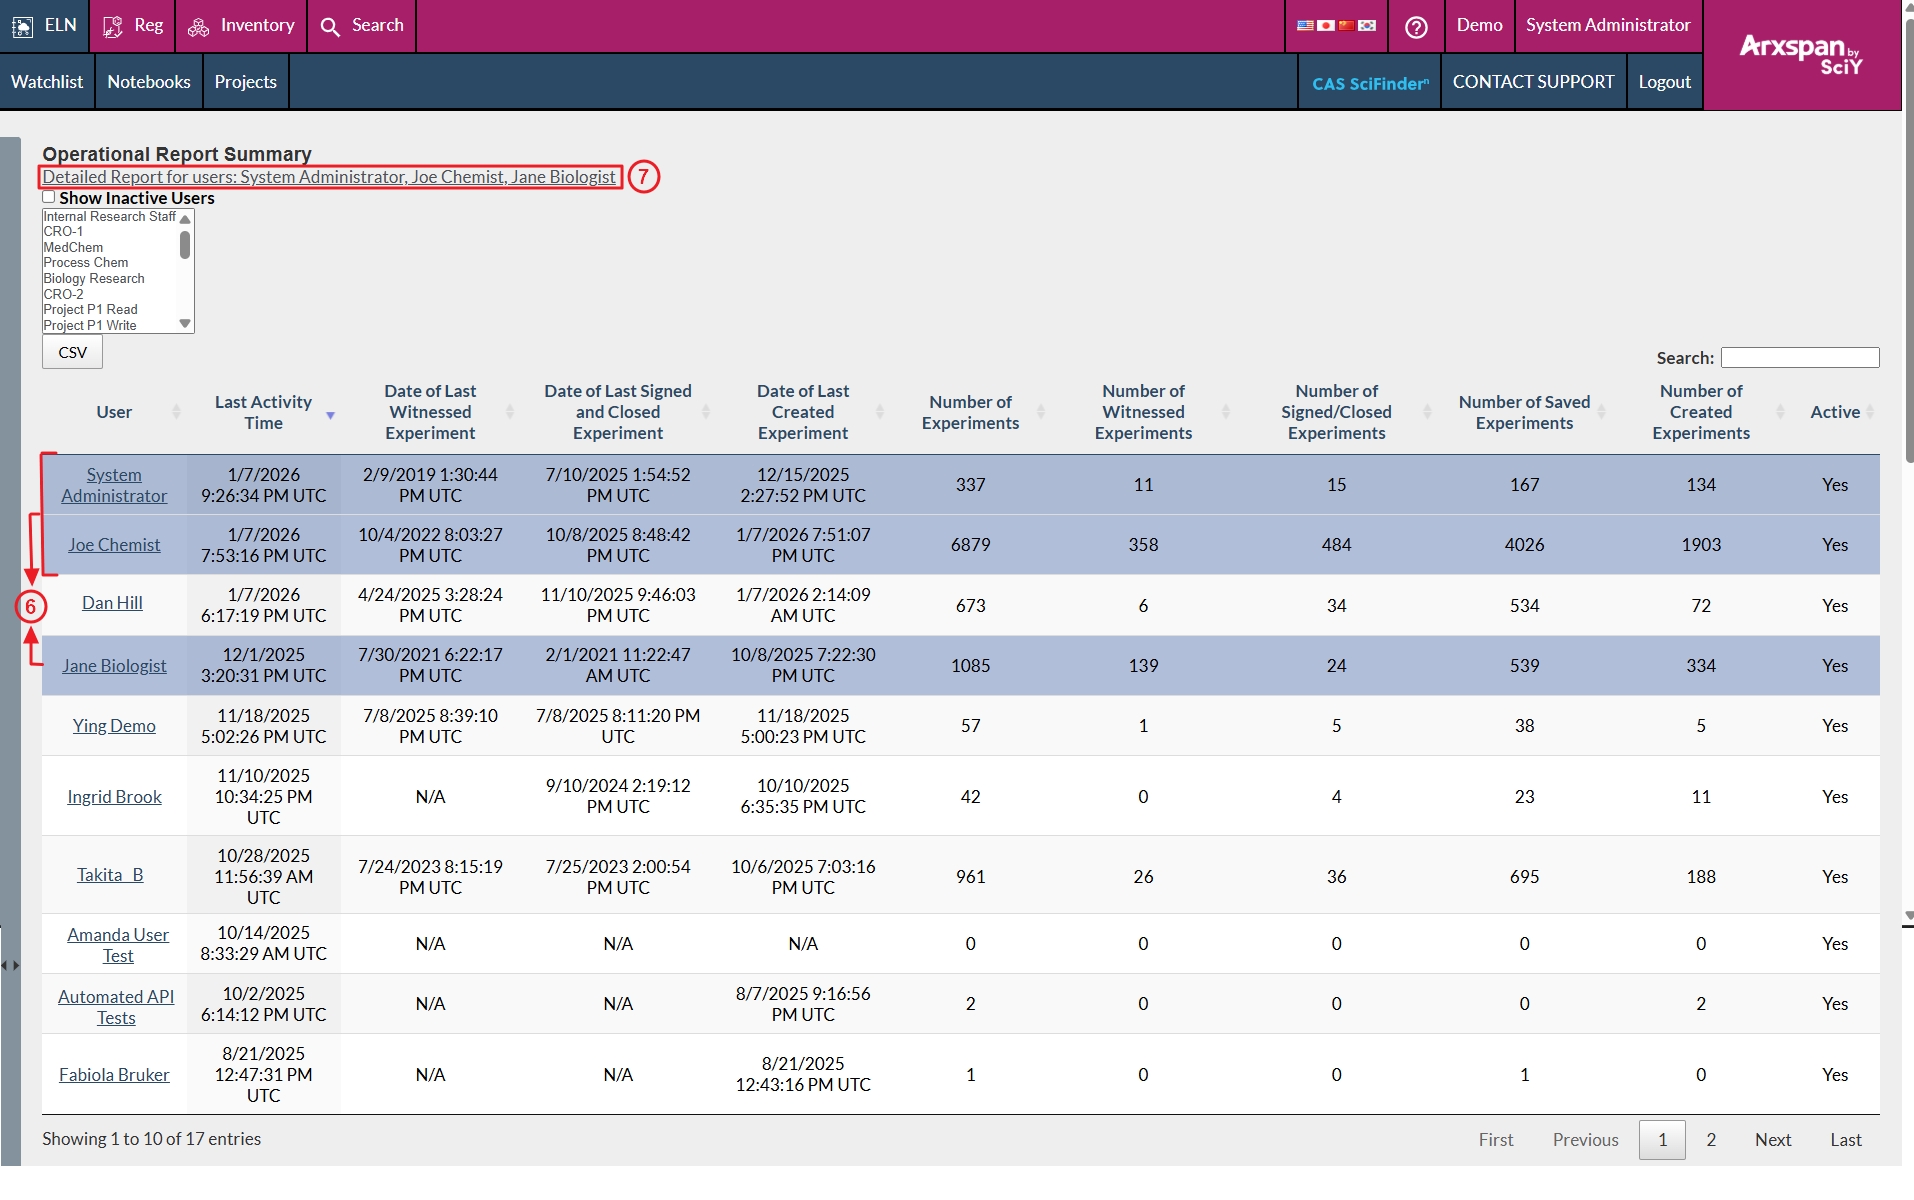
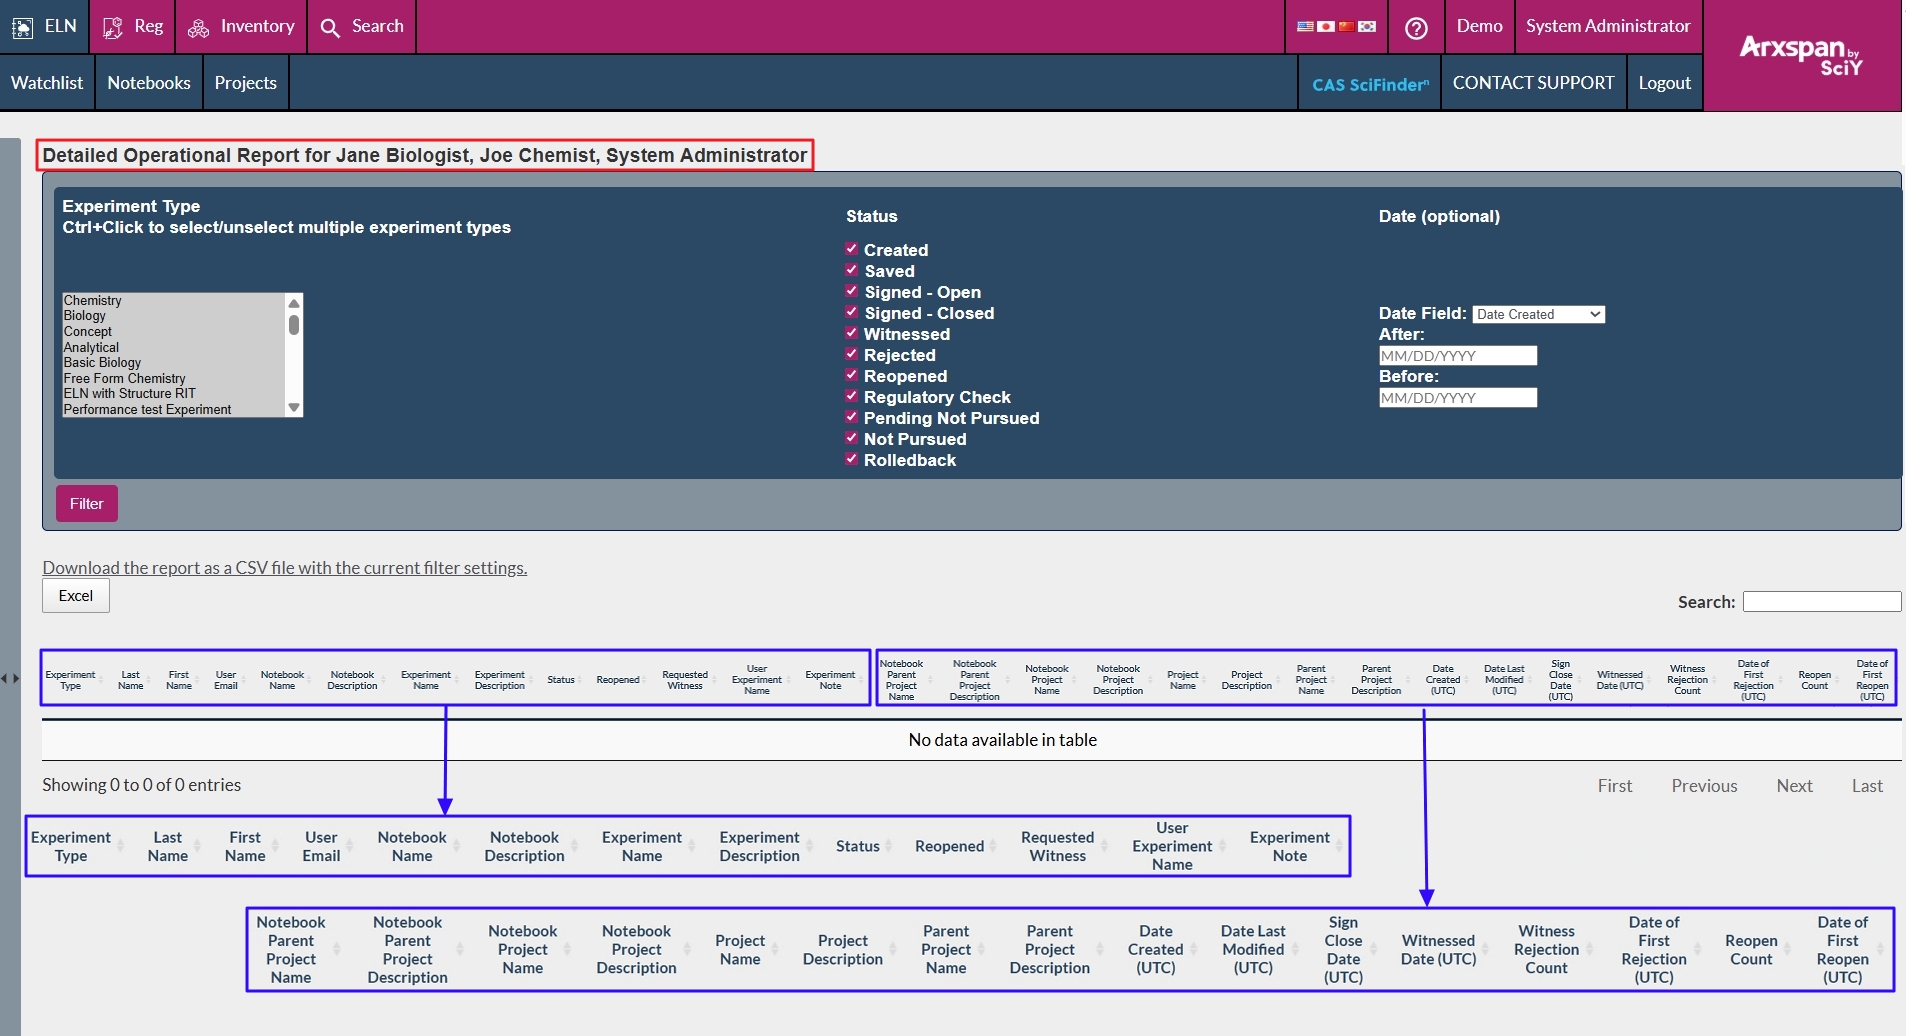
If desired, you can access a more detailed report of a user‘s, or multiple users’s, ELN activity by running a Detailed Operational Report (see next section for additional information regarding the Detailed Operational Report Summary). To run a Detailed Operational Report Summary for an individual user directly from an Operational Report Summary page, click on the hyperlink displaying the user’s name which will direct you to the report’s search criteria. Alternatively, you can also access a Detailed Operational Report Summary for multiple users by using Ctrl+Click to select multiple names from the display table (6), as shown in the first screenshot below. Click on the the resulting hyperlink at the top of the page (7) to navigate to a Detailed Operational Report for the specific users selected (seen second screenshot below).
DETAILED OPERATIONAL REPORT
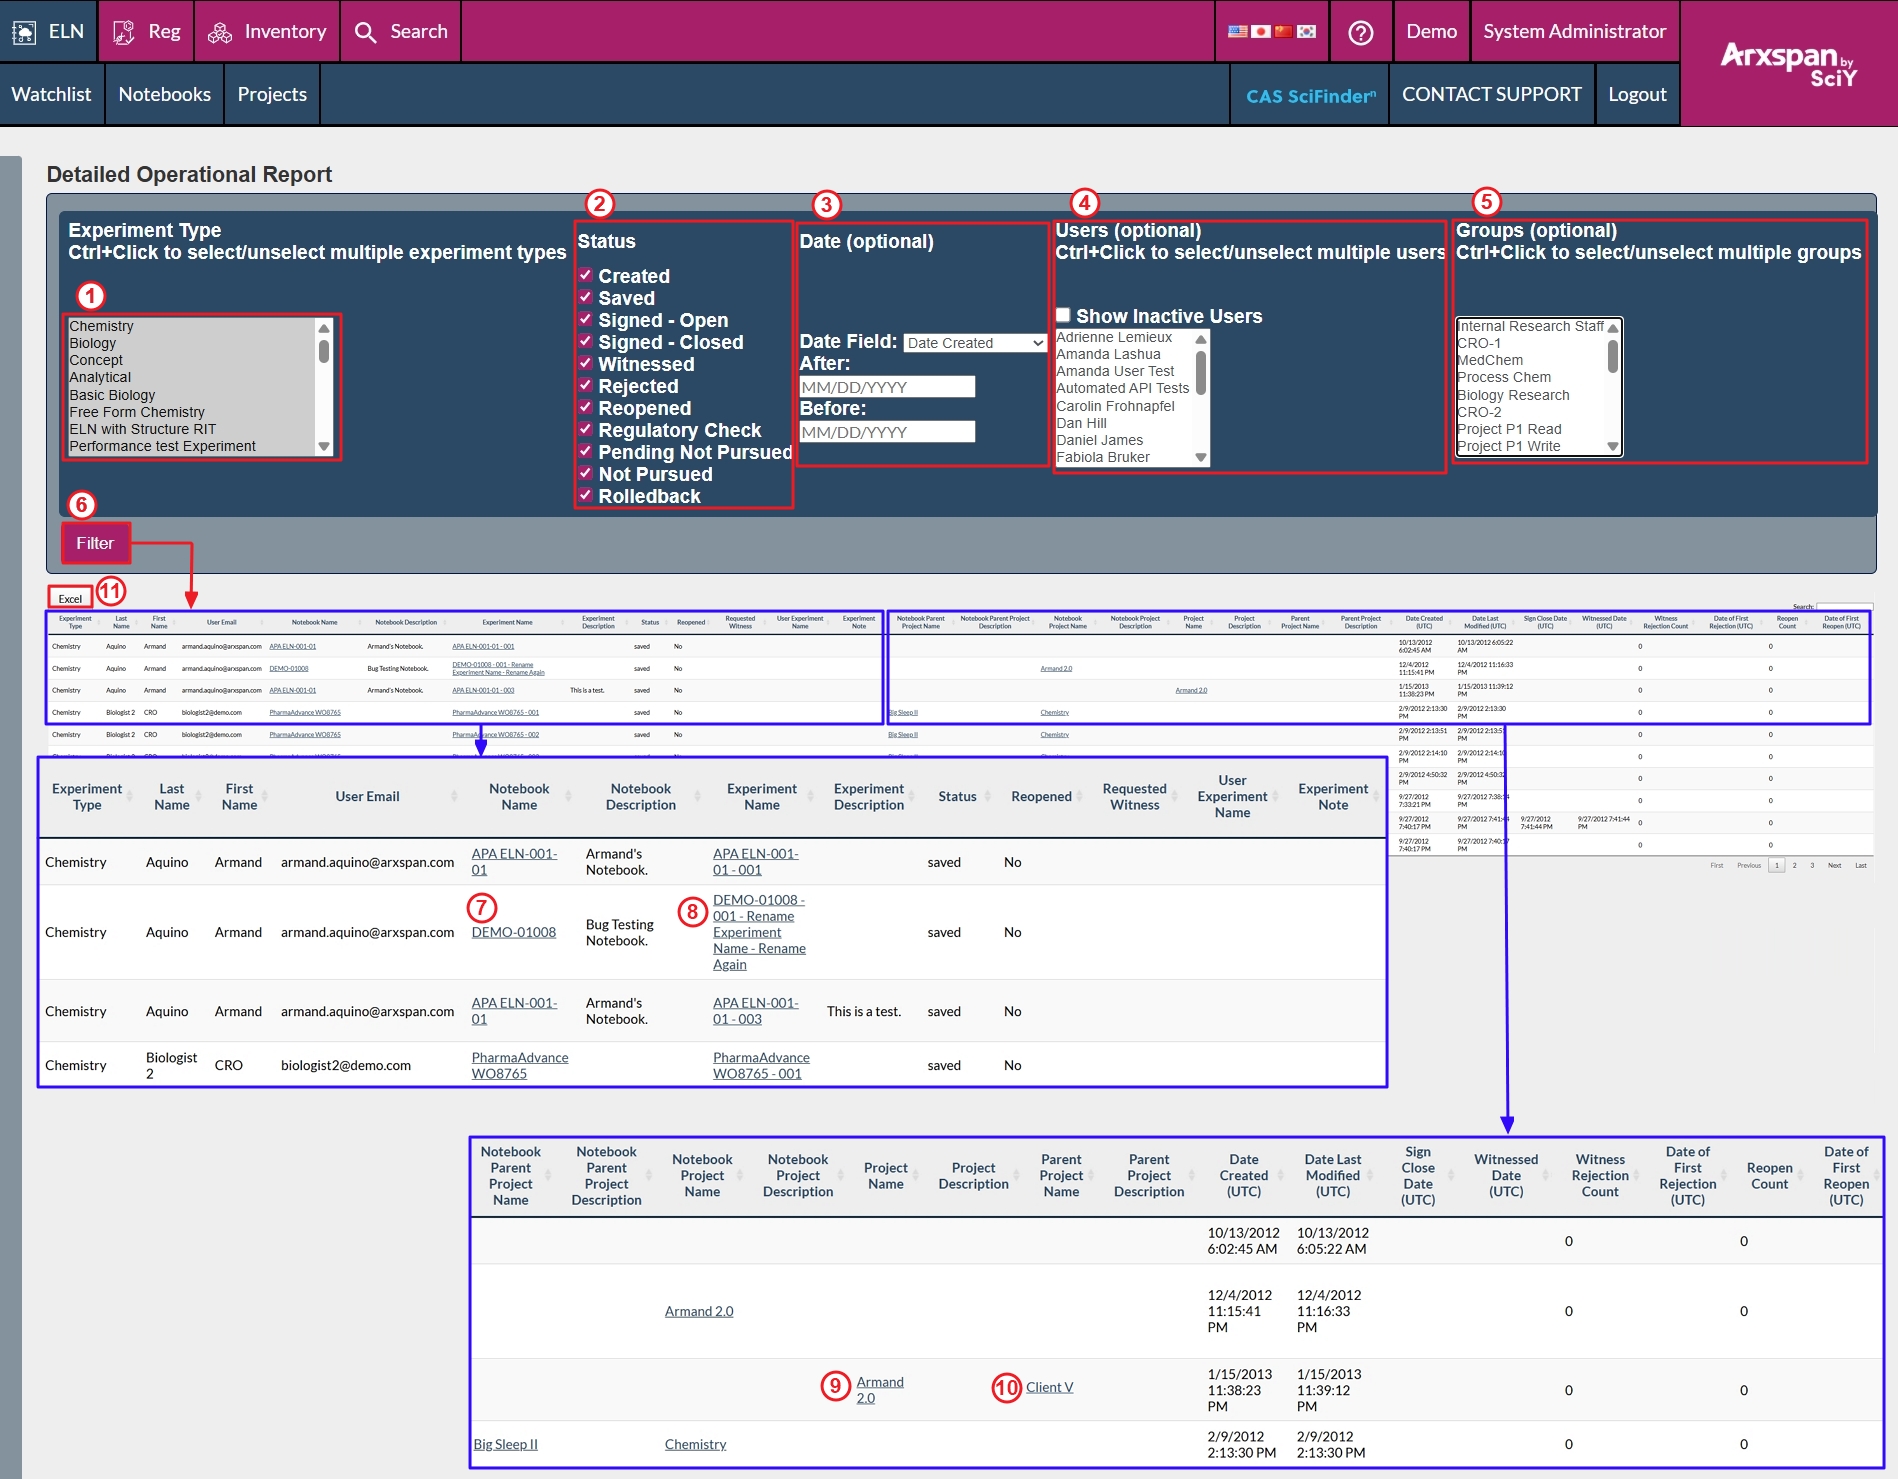
While the Operational Report Summary provides a screenshot of user‘s most recent activity pertaining to their experiments, the Detailed Operational Report provides detailed metadata for each experiment. As previously mentioned, this report can either be accessed directly from the Operational Report Summary page, or from the left-hand Navigation Bar. As shown in the screenshot below, this allows you to select specific filters like experiment types (select from a list of all system’s experiment types) (1) and experiment status (Created, Saved, Signed-Open, Signed-Closed, Witnessed, Rejected, Reopened, Regulatory Check, Pending Not Pursued, and Not Pursued) (2). You can specify the date range with options such as Date Created, Date Last Modified, Sign Close Date, and Witnessed Date (3). As with the Operational Report Summary, the report will default to run for all users, or you may select as many active (or inactive) users (4) or groups (5) to display simultaneously. Once the desired criteria has been selected, press Filter (6) to run the Detailed Operational Report.
Once run, the Detailed Operational Report results will populate based on the provided criteria. As shown in the screenshot below, each line represents an individual experiment along with it’s associated metadata. Certain metadata will provide a hyperlink to the corresponding page; for example, clicking on the Notebook Name hyperlink (7) will direct you to the Notebook page in which that experiment belongs to while the Experiment Name hyperlink will bring you to the associated experiment. The Project Name column (9) will refer to the first project linked to the experiment. In the case that the linked project is a Sub-Project, then the Parent Project Name (10) and Description will be populated with the sub-project’s corresponding Parent Project information. As with the Notebook Name (7) and Experiment Name‘s (8) provided hyperlinks, the Project Name (9) and Parent Project Name (10) values will be live hyperlinks directing you to the associated project page.
As with the Operational Report Summary, results can be sorted by the desired column header by pressing the up or down arrow to the right of the desired column header’s name. Finally, the Detailed Operational Report results can then be exported as an Excel file (11) for further analysis and/or future reference. Please contact either Arxspan Support or your Arxspan Representative with any questions or for additional information.
